

Reporting Module Documentation
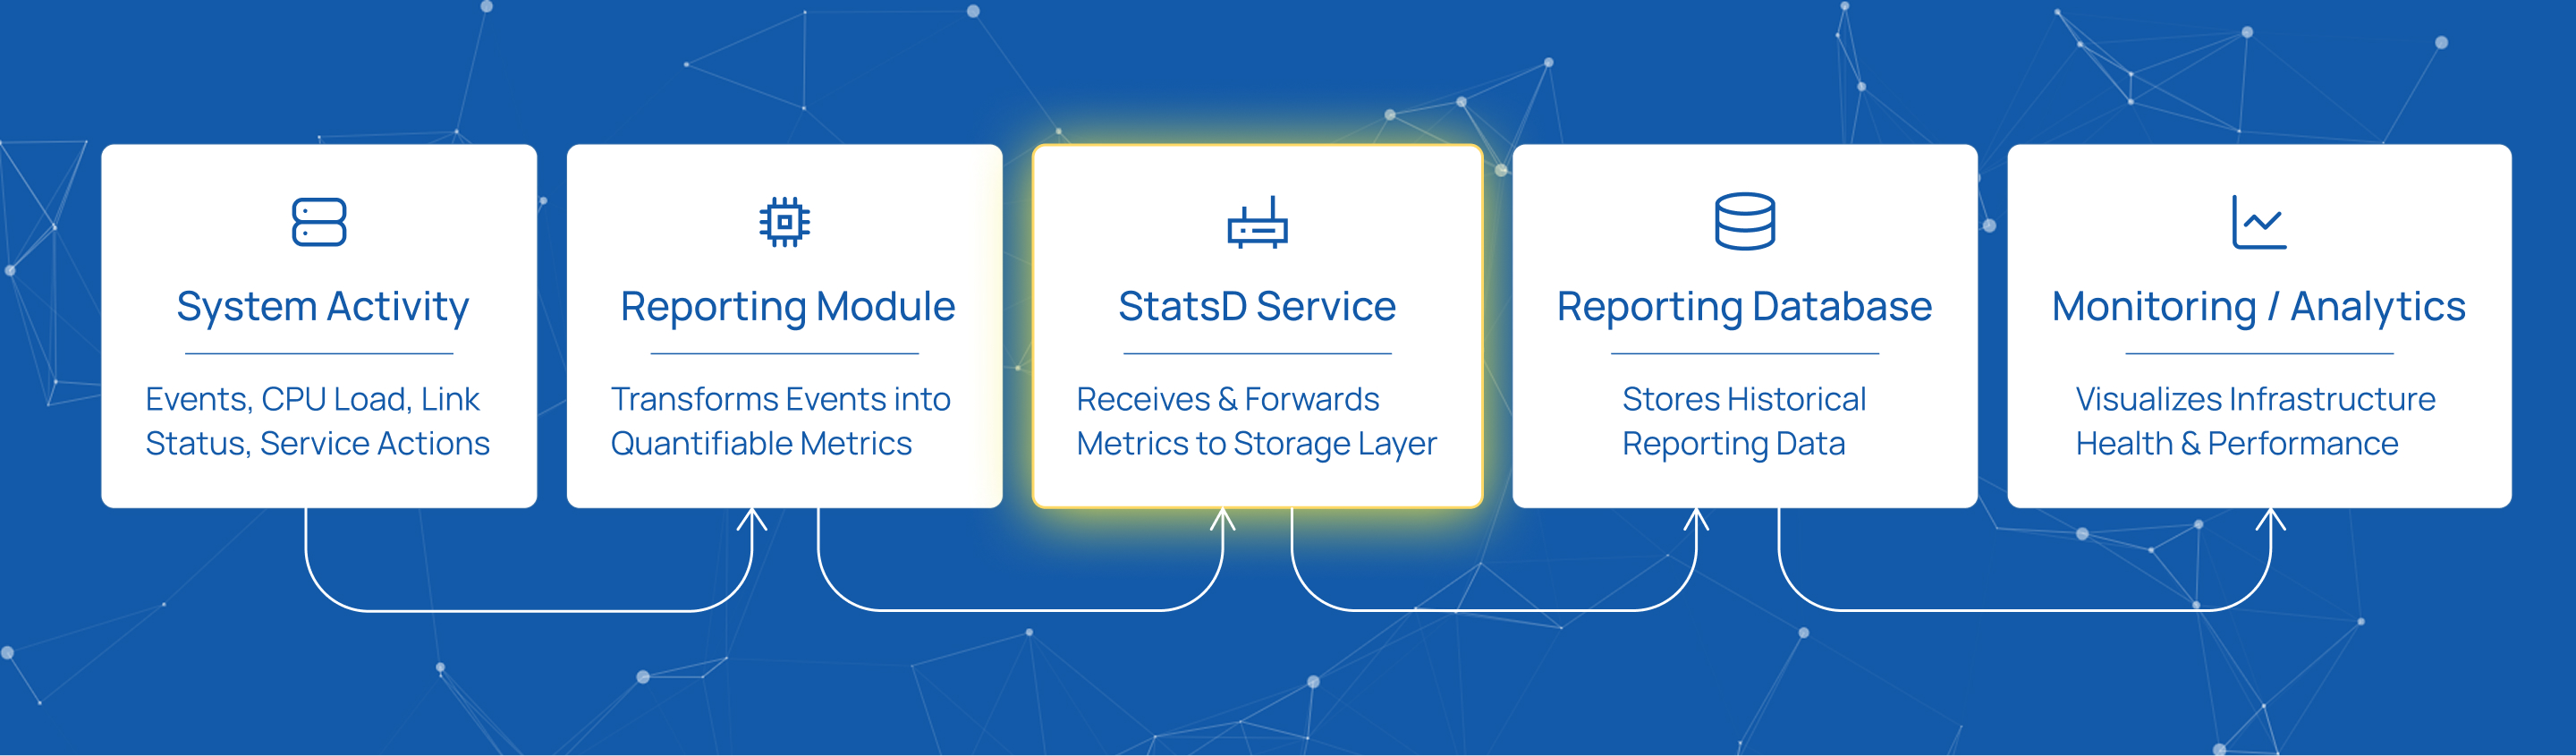
The Reporting Module serves as the central intelligence layer of the platform, acting as the system’s “vital signs” monitor. It transforms every action occurring within the system into quantifiable data, providing visibility into environment health, communication link status, CPU performance, and overall deployment stability.
To ensure metrics are captured accurately and sent to the correct destination, the module must be configured with several core parameters.
Data Collection and Storage Configuration
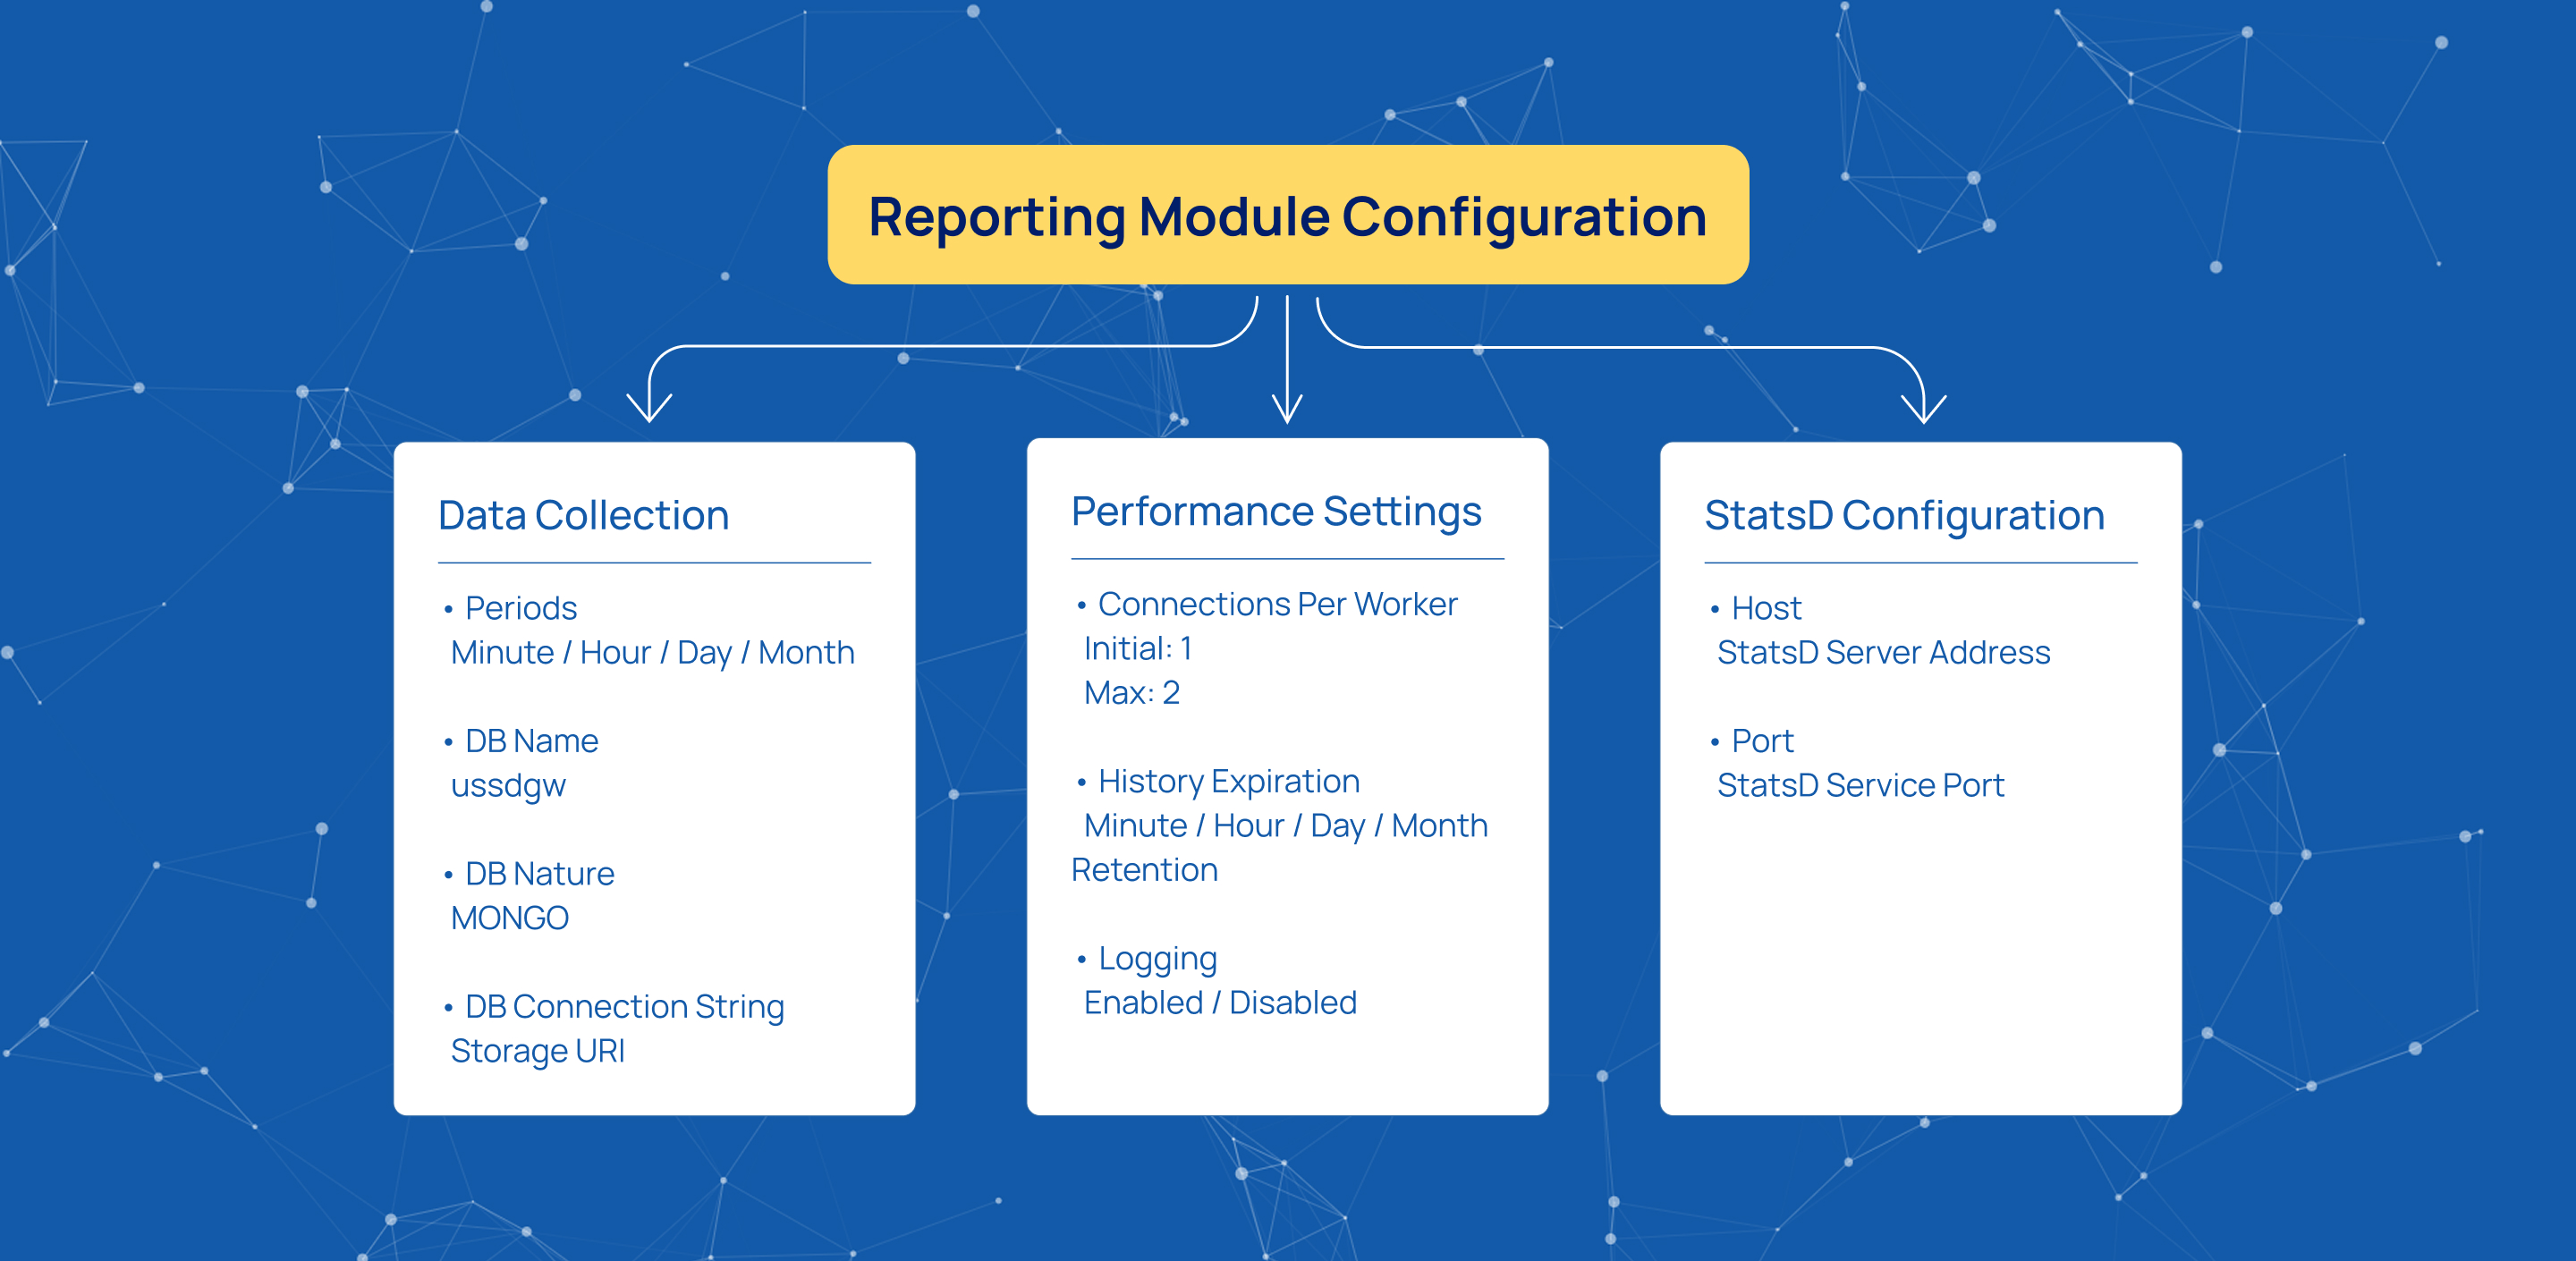
Periods define the time intervals over which metrics are collected. For example, Minute can be used for highly granular tracking, while Hour, Day, and Month support longer-term analysis.
DB Name specifies the database identity used for reporting storage, such as ussdgw.
DB Nature defines the storage engine used for reporting data, for example MONGO.
DB Connection String specifies the URI used to connect to the reporting storage layer. Detailed connection string configuration is covered in the Configuration Storage documentation.
Performance and Retention Settings
Connections Per Worker controls the number of database connections allocated per worker, including Initial and Max Connections. For the Reporting Module, recommended values are 1 Initial and 2 Max Connections.
History Expiration (Sec) defines retention periods for minute, hourly, daily, and monthly reporting data. Increasing retention periods significantly raises storage usage, memory consumption, and long-term report generation time.
Logging is Enabled controls whether internal reporting events are recorded for debugging and monitoring purposes.
StatsD Configuration
A critical part of the Reporting Module is the StatsD Host and Port configuration.
StatsD is a network service that collects statistical data and forwards it to monitoring and visualization systems. It acts as a lightweight intermediary, allowing the application to emit metric events without waiting for database responses and without slowing down system operations.
The StatsD Host specifies the IP address or domain name of the server running the StatsD daemon, while the StatsD Port defines the network port assigned to the StatsD service. Together, these values determine where reporting metrics are transmitted.
Summary
A properly configured Reporting Module provides deep visibility into infrastructure health without compromising system performance. By balancing retention policies, connection settings, and serialization efficiency, raw metrics become a reliable foundation for real-time monitoring and proactive maintenance.
Start innovating with Mobius
What's next? Let's talk!