

Mobius System Stats: CPU, Memory, Tasks & Metrics
System Stats provides an overview of server resource usage and overall system health. A server has limited processing power and memory, and resource usage is not always visible. System Stats makes this information available for monitoring and analysis.
Use System Stats to monitor:
- CPU usage
- Background tasks and timers
- Server and application memory
- Historical data and system metrics
Reporting Settings
Before collecting data, configure Reporting Settings. These settings define the reporting intervals, database, and data retention period.
Available intervals include:
- Minute
- Hour
- Day
- Month
System Stats Page
The System Stats page provides tools for viewing and exporting system data.
The toolbar includes:
- Mode — defines how data is fetched.
- Periods — defines the time interval based on Reporting Settings.
- Start Date — defines the beginning of the selected time period.
- Stop Refresh — enables or disables automatic updates.
- View — reloads the charts.
- Export — exports the data to a spreadsheet.
System Statistics
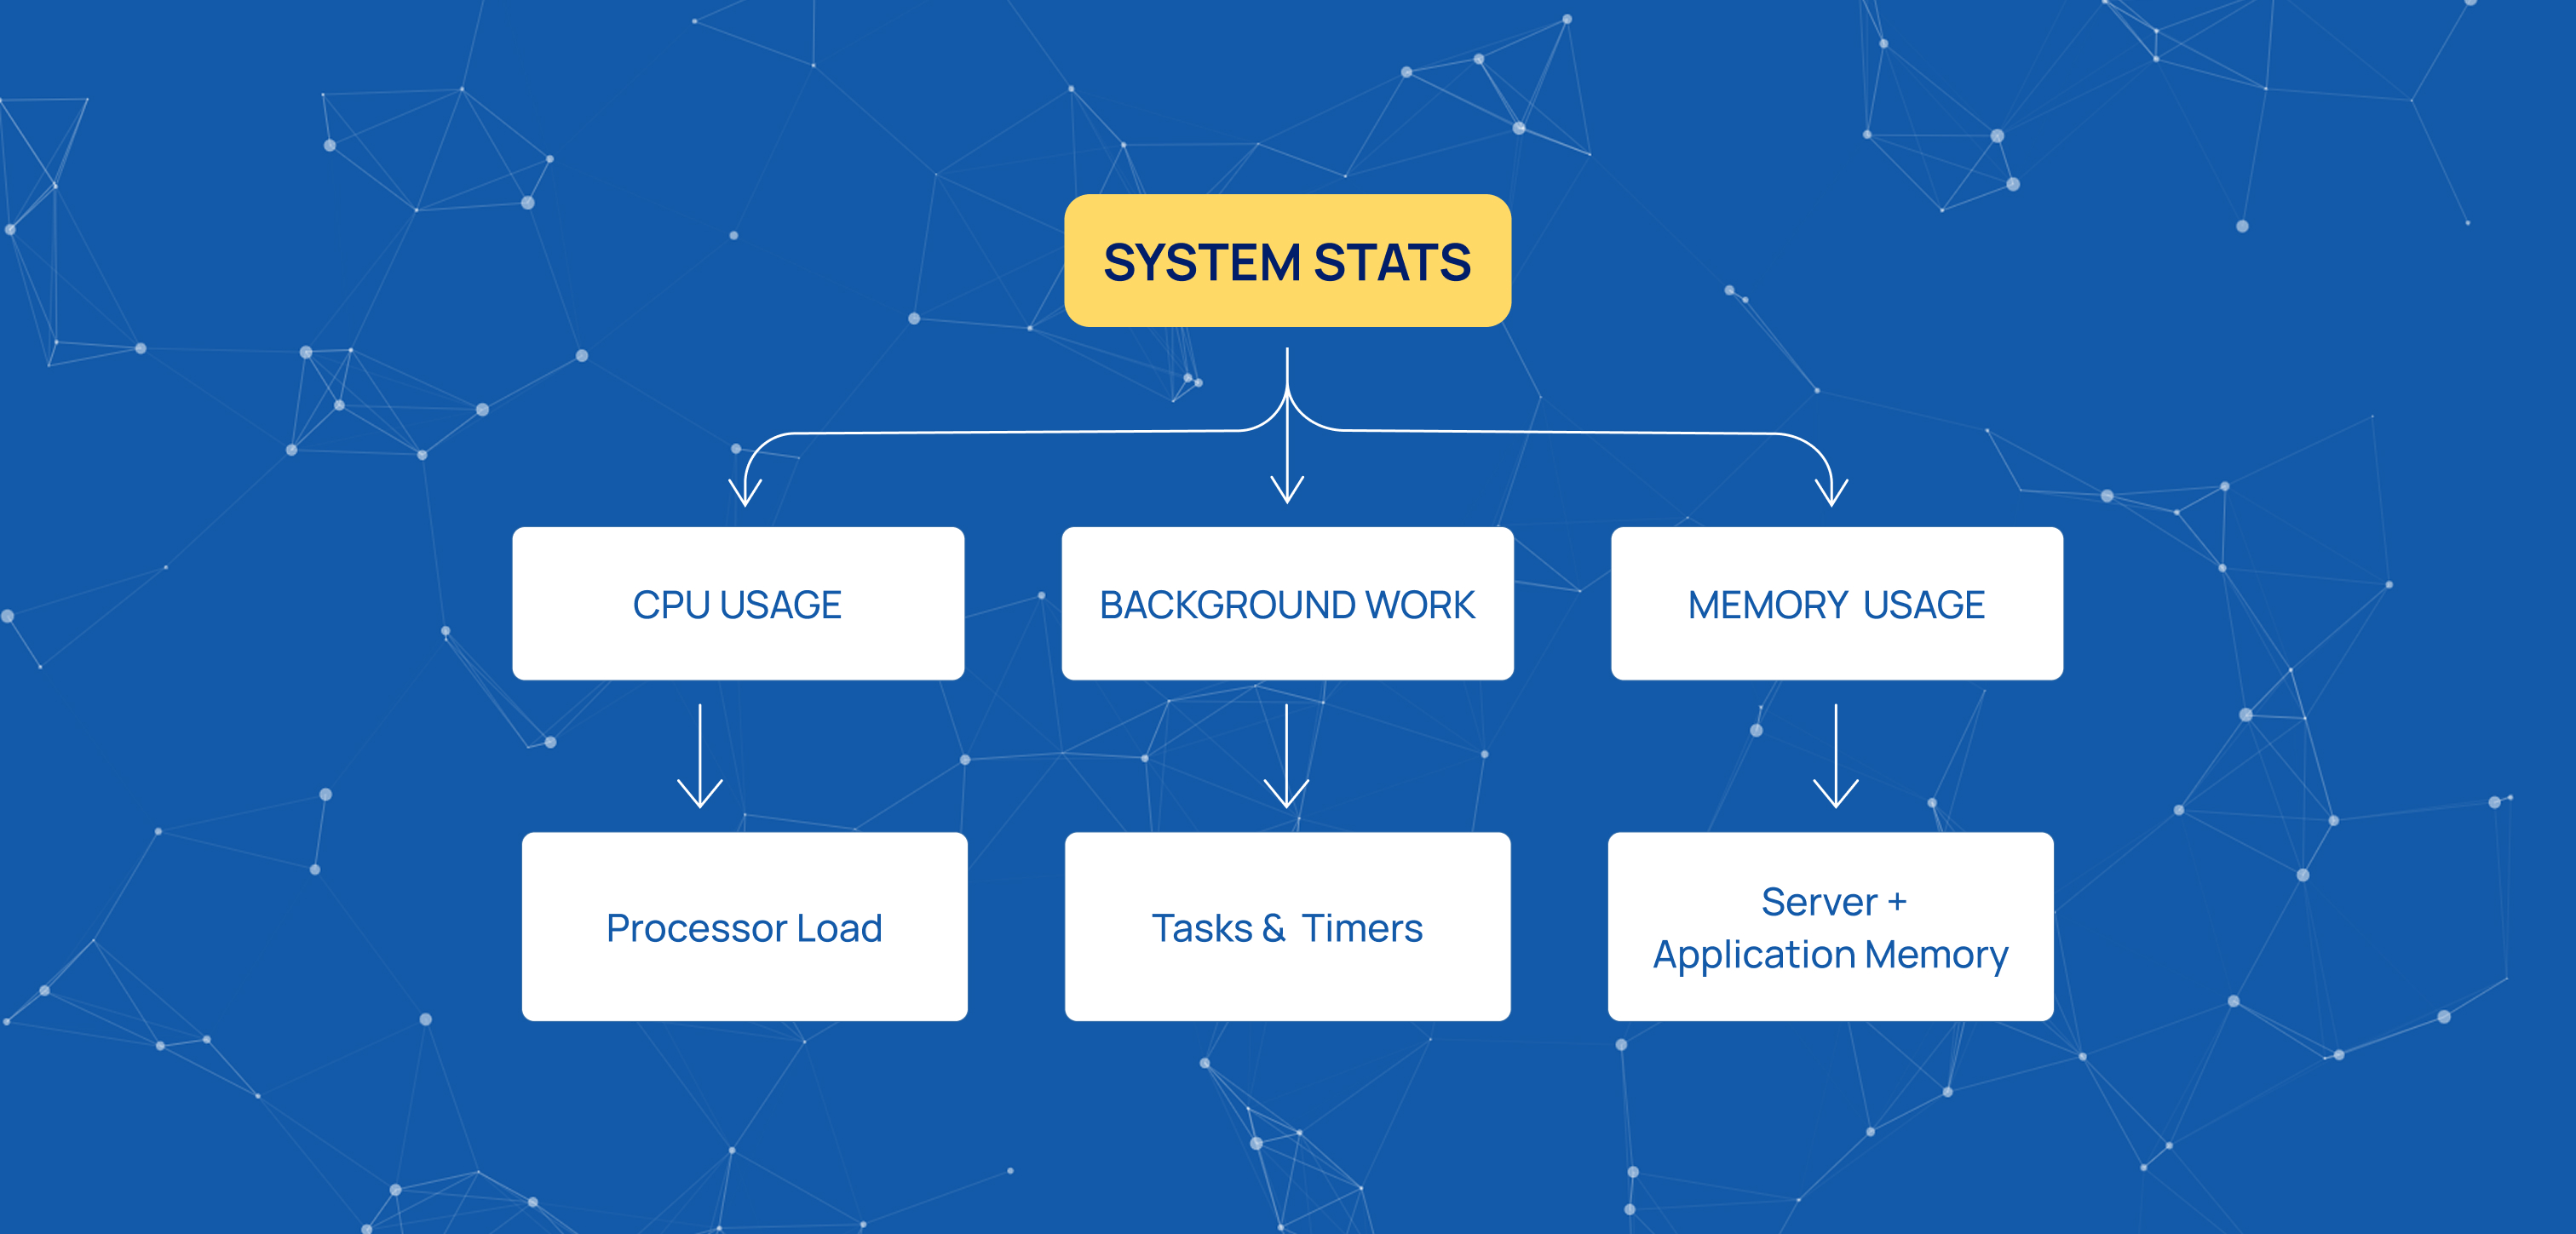
The System Statistics section provides an overview of CPU usage, background work, and memory usage.
CPU Usage
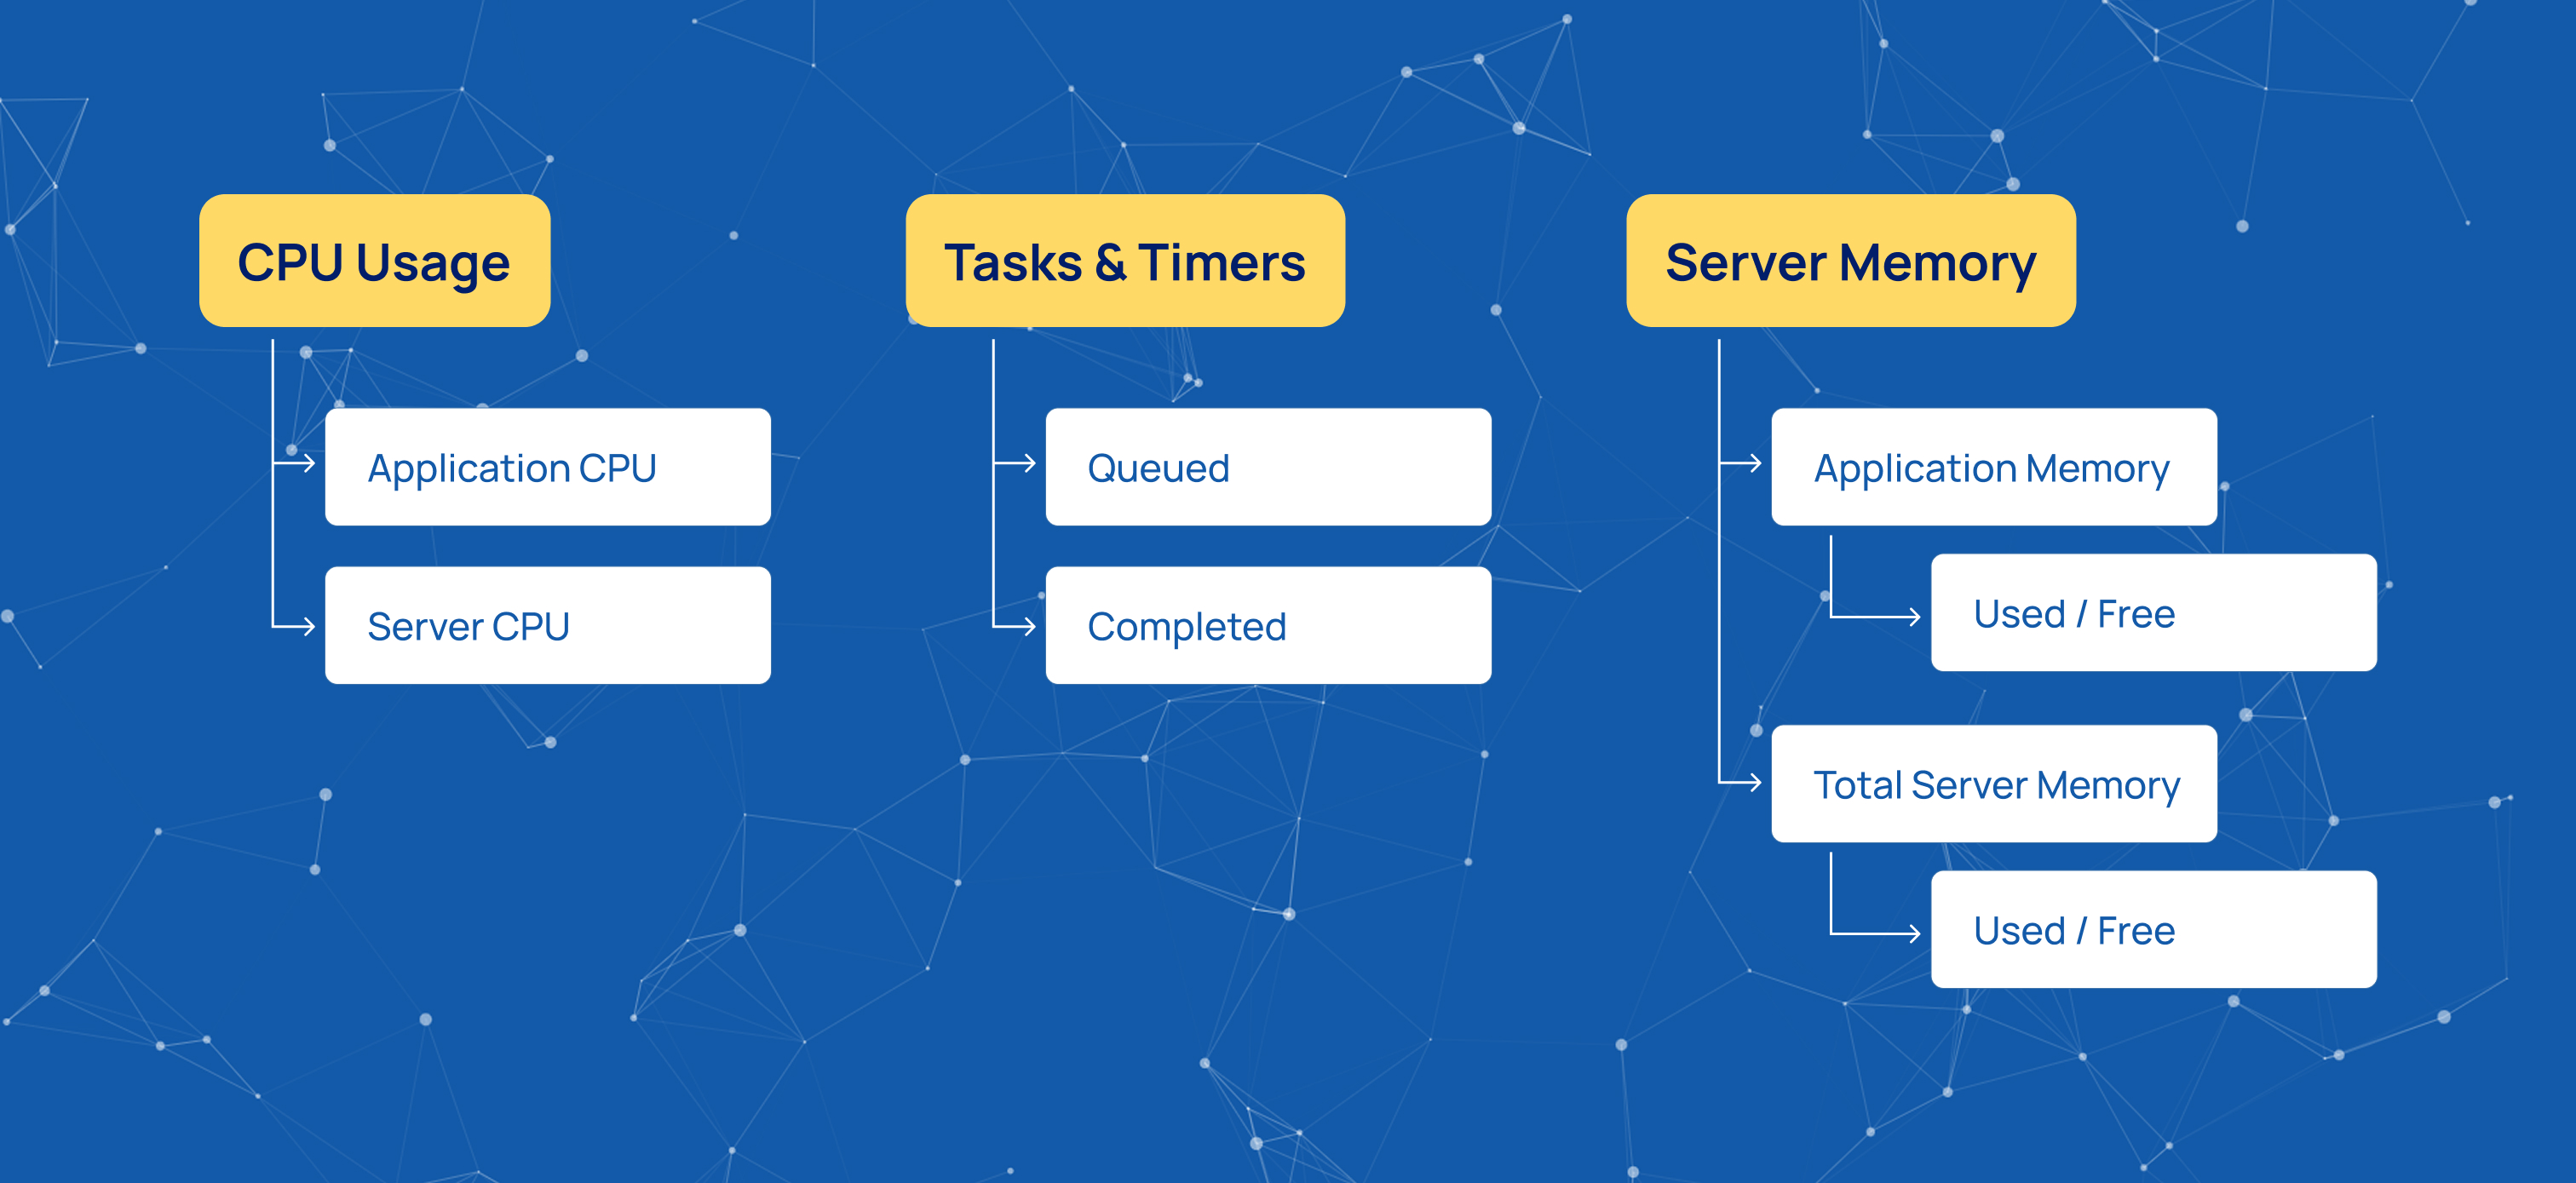
Shows application CPU usage and total server CPU usage.
Tasks and Timers
Shows queued and completed tasks and timers. Comparing these values with CPU usage helps monitor background processing.
Server Memory
Shows application memory and total server memory. Memory Status charts show used and free memory.
Groups, Metrics, and Reporting
Every chart value is represented by a metric. A metric can optionally belong to a group.
For example, cpu.app represents application CPU usage. On a single server, a group can contain one metric. In a cluster, the same group can contain metrics from multiple nodes.
A metric can be referenced by its full name or by its group. Using the full name displays a specific metric. Using a group collects metrics from all nodes in that group.
A full metric name consists of a group and a node.
For example:
cpu.app.main.0001
Here, cpu.app is the group and main.0001 identifies the node.
Metric Structure
The metric structure can be represented as:
Group → Node → Metric → Chart
For example:
cpu.app → 0001 / 0002 / 0003 → Metric → Chart
In a single-server environment, the node is the same. In a cluster, each node has a unique identifier.
Reported Metric Groups
The reported metrics are organized into several groups.
CPU
cpu.summary— total processor loadcpu.app— platform process processor loadprocessors.summary— number of processor cores
Memory
memory.system.used— system memory usedmemory.system.free— system memory freememory.app.used— application memory usedmemory.app.free— application memory freememory.system.summary— system memory summarymemory.app.summary— application memory summary
Background Work
tasks.queued— queued taskstasks.pending— pending taskstimertasks.queued— queued timer taskstimertasks.pending— pending timer tasks
Metrics Used in Charts
The summary groups processors.summary, memory.system.summary, and memory.app.summary are not displayed directly in charts.
Memory usage is already represented by the used and free memory metrics and the Memory Status charts.
All other reported metric groups are used directly in the charts.
System Health Overview
System Stats provides an overview of CPU usage, memory usage, background processing, and system metrics. The available data can be viewed for selected periods and exported for further analysis.
Start innovating with Mobius
What's next? Let's talk!